
This is the fifth part of our series on Lean Project Management. In this post, we look at resource management.
Resource loading and queue time
In the previous post, we discussed briefly that resource loading has a high impact on queue time, and one way to minimize queue time was to increase the capacity of our resources. This is probably not surprising. We have all experienced many examples of this, such as Black Friday, rush hour, airport security, and the post office at lunchtime in December. When there is too much work for the resources who need to process that work, wait times get very long.

Figure 1: Example of overloading the system resources
The amount of time it takes to get through a system increases exponentially as capacity utilization (system loading) increases. One system we can use as a reference is the manufacturing floor. Ask a manufacturing manager how highly they load their production system and most will say they plan their machines to operate 80 to 85%. In other words, about an hour and a quarter of every day is left unallocated.
Why leave the production tools so much extra time? Because, even in low-variability environments like manufacturing, ‘stuff’ happens (defects, rework, unplanned maintenance, etc.). (variability) If you load the system too fully, these issues can bring the production line to a screeching halt. In order to keep the system flowing, we need a little unallocated capacity.
So how much unallocated capacity do we leave our development resources to keep the development system flowing quickly? Most often it is much higher than 80%. It may start out early in a project at 80%, but soon thereafter ‘stuff’ happens, the schedule starts to slip and the resources are loaded back up to 100% trying to make up for the slip. Ask the resources themselves and most will say they are loaded well above 100% even at the beginning of a project.
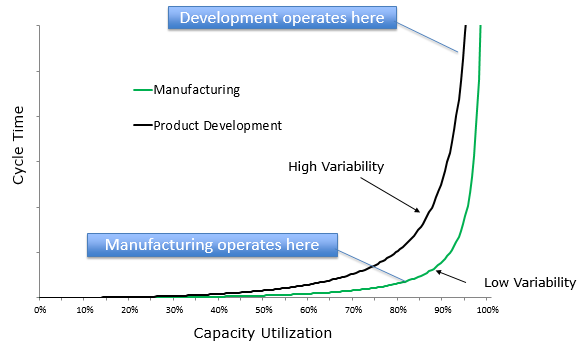
Figure 2: Impact of Resource Utilization and Variability on Project Duration
As figure 1 shows, in systems where variability is higher such as product development, we need even more unallocated capacity, not less. This overloading of the development system is a chronic issue which has an enormous impact on the lengths of our projects.
Resource management and Resource Utilization
There is another analogy we can use to describe this issue – a car race. When we plan our resources to high levels of utilization we theoretically have a more ‘efficient’ system, with less wasted money on potentially unused capacity. But ‘efficiency’ is slow, which costs a lot in terms of the cost incurred by delaying a product to market (Cost of Delay). We can’t win the Product Development race by driving an efficient 4-cylinder Honda that gets 40 mpg. We win it by driving the fast Ferrari that gets 10 mpg, and we make a lot more money in the process.
Speed is more profitable than efficiency.
One of the keys to Lean Manufacturing is to reduce variability. However, variability is absolutely necessary in product development to innovate. Customers want to buy innovative, new products, and with innovation comes uncertainty (risk, unexpected defects, rework, etc.) and variability. Simply stated, to add value there must be variability.
Variability causes the duration curve to rise sooner, so for faster projects we must operate the product development system with even more spare capacity. Resource Utilization must be planned at 70% or even lower for high-innovation/high-uncertainty projects. This drastically reduces the wait time on each task, and, in product development, also reduces execution time.
Resource loading and project duration
Recall from the previous post that the total duration of each task, from the minute it arrives in the queue to the minute it is completed, can be calculated using this simple formula:

Total Duration = Wait + Execute
Execute time for most tasks has a very simple formula as well.
Work is the total hours of work required to perform the task. Availability is the amount of time a resource has, per day, to execute that task. For example, a 12 hour task performed by a resource with 3 hours a day to work on it will take 4 days to complete.
Execution time grows exponentially when our product development resources are overloaded because they are forced to multitask, which decreases their availability.
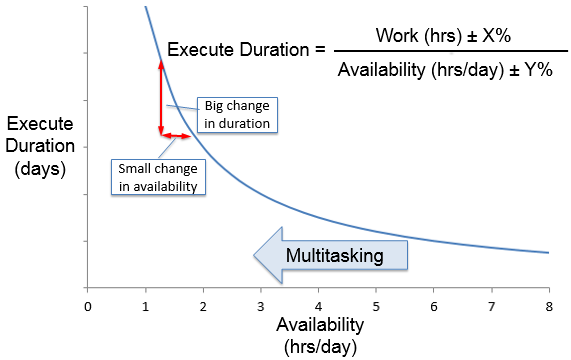
Figure 3: Multitasking Increases Duration AND Reduces Certainty
When there are are too many active projects and activities, there is always another meeting to attend, email to read, or person knocking at the door to discuss something – all of which reduce our resource’s availability to get their work done. When there are too many tasks to work on, resources tend to multitask across several of them which further decreases their availability to each task. The result is much longer execution times for those tasks.
Not only are the task durations longer, they are less certain. As shown in Figure 2, when our resources’ availability to each task is already low, little changes to their availability have a big impact on the duration of their tasks.
Uncertainty in execution time comes from uncertainty in the amount of work (±X%) and resource availability (±Y%).
We all experience days when we get nothing done because we spend the whole day in meetings, emails, phone calls, and interruptions. On those days our availability to design, experiment, research, and other sit-and-do-the-work type tasks goes to zero. Availability varies from zero to about seven hours per day, or about 3.5 +/-100%, unless we work more than 8 hours a day.
In contrast, the variance on our work predictions is often 50%, when we spend a little time to think through task or base the estimate on real data from past tasks.
Without a concerted effort to maintain our resource’s availability, it is likely to fall below the the 6.4 hours a day we assume when we plan resources to 80% utilization. If actual availability is 4 hours/day and we estimate it at 6.4, our projects become 60% longer (6.4/4) and that assumes we correctly estimate the work, which is also rare.
The result is longer projects, therefore more pressure resulting in more push, and more multitasking. Management can become anxious to start the next project in hopes of completing it done earlier. These reactions just makes matters worse. And as overloads increase, people take more risks, which result in even more work later. It is a vicious cycle produced largely by overestimating people’s availability and loading the system with too much work.
Variability and innovation
While variability is necessary for innovation, it is also true that some forms of variability do not create value - some forms are bad. For example, forgetting to connect the wires to record data during a 1 week material fatigue test and not discovering this until the end of the test. Some techniques for reducing bad forms of variability are outlined below. The first four techniques above reduce work or make it more predictable. The last technique increase availability. All of these result in shorter and more predictable projects.
- Reuse designs where innovation doesn’t add value (don’t reinvent the wheel)
- Standardize processes (e.g., a checklist to remind the test operator to connect the wires used to record test data; drawing release process, etc.)
- Automate tools and processes (e.g., leverage computer software to do repetitive tasks and take human error out of the equation)
- Base work estimates on data, not guesses. Use actual work measured on similar tasks from the past.
- Measure and control Resource Availability using Time Blocking, limiting Work-In-Process (WIP), minimizing multitasking, and removing or deferring less critical work.
Time Blocking is the practice of setting aside, for example, three hours every morning from 9 to 12 for the resources to get their tasks done. During this time, we minimize or eliminate status meetings, interviews, performance reviews, interruptions, and other activities which take resources away from completing the tasks assigned to them. Although, these activities are still important, the benefit of time blocking is that average availability is increased and the variance is reduced. By insuring that at least a little work gets done each day, we improve the flow through our development resources.
Visual management and resource loading
Like showing the queues in our system, typical VWM tools and formats only do a little to help control loading and increase resource availability. Most accomplish this by limiting Work-In-Process: the number of active tasks any one resource can be working on at any one time.
Unfortunately for hardware teams, because of procurement times and other causes of forced wait time, the resources have upwards of three active tasks at any one time. This reduces multitasking somewhat, but not as much as it should, because daily multitasking remains invisible.
In addition, especially when using physical VWM project boards, it is impossible to apply work to the stickies and have it roll-up to an overall utilization level for the resources. Instead, this is approximated in other tools which are separate and out-of-sync with the day-to-day tasks.
Playbook is different
In Playbook, daily multitasking is highly visible, as are short term and long term overloads.

Figure 4: Utilization across projects
In the Standup meetings, and in the view where the resources update and schedule their work, we can easily see overloads. When resources are loaded above 50%, the capacity dial turns yellow, and when they are loaded above 70%, it turns red. This loading updates immediately as tasks are resized, added, and removed from the resource, providing instant feedback.
With this visibility, we can help resources know what priorities to focus on and what tasks to defer. We can take actions to increase the availability of the resources who are most critical, such as removing them from a meeting to focus on their critical tasks. Lastly, we insure there is room for the stuff that happens (variability), so that stuff doesn’t kill our project schedules.
Stay tuned…
In Part 6, we will clarify pull vs. push in a development system, and showed the importance of establishing ‘pull’, first at the resource level and eventually the system level, in order to limit multitasking and maximize speed to market.
----
Do you know the number one cause project delays? It's not what you think. Watch this 9-minute video to find out what it is.

Related articles
Lean project management
Lean project management methodology
Lean project management Kanban
Lean project management principles
Resource management
Pull vs. push
Task management
Shared project buffers
Decentralized planning
Daily stand-up meetings
Guide to Lean Project Management
