
In order to make project decisions such as whether or not to add a new feature, we need an economic model. Cost of Delay is one input into this model. We explored how to calculate it in our last post.
In this post, we explore the other inputs required to build an economic model that is effective for making economic-based project decisions such as sales volume, unit cost and development cost changes.
Project model inputs
Cost of Delay (COD) is only one of the outputs from your project economic model which are needed to make new product development decisions based on Profitability and Return on Investment. Other outputs are the impacts on profitability of changes in sales volume, unit costs, and the cost of development. *
Where COD is the "Sensitivity to Schedule," these other terms are the Profit Sensitivities to changes in sales volumes, unit costs, and expenses.
Fortunately, these sensitivities are easier than COD to quantify, estimate and subsequently are easier to achieve wide buy-in to as well.
Sensitivity to Sales Volume
Estimating sensitivity to sales volume is similar to calculating ‘Peak Reduction COD’ as discussed in Post 3. You can estimate it several ways. *
Sensitivity to sales:
= 1% * total volume * average margin per unit
= 1% * total profit
= 1% * average monthly profit * number of months forecasted
= 1% * avg. monthly volume * avg. margin per unit * # of months forecasted
Using the last formula above with example in Post 3, where an average monthly volume of 150 units was forecasted for 48 months, at a margin of $2000 each, the Sensitivity to Sales calculation is as follows:
1% * 150 units per month * $2000 per unit * 48 months ~= $150K.
For every 1% of sales volume we add (or remove), we will be gaining (or losing) $150K of profit. If we, for example, added a feature which would increase sales by 5%, we would make approximately $750K more in profit over the forecasted period (minus the delay cost and expenses resulting from adding the feature).
Notice, the 1% Sensitivity to Sales is half of the cost of the 2% Peak Reduction COD example in post 3. If you determine the Sensitivity to Sales first, it is easy to estimate the Peak Reduction COD. If the peak reduction is 3% simply multiply the Sensitivity to Sales Volume by 3 to estimate it.
Sensitivity to Unit Cost
Estimating Sensitivity to Unit Cost is also relatively straightforward. To estimate it on a percentage basis, simply determine 1% of the estimated unit cost and multiply it by the number of units sold over the forecasted time.
For our example product, we have a 50% margin on our product. We sell it for $4K, our margin is $2K each, and our unit costs are $2K each. To calculate the Sensitivity to Unit Cost take 1% of the unit cost and multiply by the total number of units you expect to sell during the forecasted period.
1% * $2K per unit * 150 units per month * 48 months ~= $150K
For easier decision calculations, however, it is helpful to determine Sensitivity to Unit Cost in dollars rather than percentage - dollars profit, per dollar of unit cost reduction. It is easy to estimate this by estimating the total number of units you expect to sell over the forecasted period and multiplying this number by $1.
$1 per unit * 150 units per month * 48 months ~= $7200 per dollar of Unit Cost reduction
With this, for example, we can estimate that if we were to reduce the unit cost by $100, it increase our profit over the forecasted period by $720K (again - minus any delay cost and expenses we incur by reducing our unit cost.)
View our complete guide to cost of delay.

Sensitivity to Project Expenses
To calculate the Sensitivity to Project Expenses determine 1% of development expenses -- this number is used primarily to provide the level of scale of this sensitivity relative to the others. Once again, when performing tradeoffs, we use dollars instead of percentages . For example, we will enter that we would spend $10,000 on a particular change to the plan, rather than 1.2% of the budget.
For example, if our total project expenses are expected to be $2.5M, our sensitivity to Project Expenses is $25K.
Sensitivity Values are Highly Variable
Sensitivity values are highly variable and depend on the nature of your market and your product. We’ve seen CODs on product development projects as low as $20K per month and as high as $15M per month.
There are some common themes, though. Typically, for new-to-the-world and new-to-the-company products like used in the examples so far, COD dwarfs the other sensitivities. In this example, COD is $400K per mo ($1K per week), where 1% of sales volume is worth $150K, 1% of COGS is $150K, and 1% of project expenses is $25K.
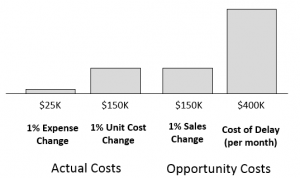
Figure 1: Example Economic Sensitivities
Notice, one month is more than 1% of the schedule. But how long would you need to extend the project to reduce unit cost 1% or add a feature that would increase sales 1%? Sometimes more than a month, sometimes less. Thus one month of delay is approximately an ‘apples to apples’ comparison with 1% of sales or unit cost.
Regardless of the units we use, crunching the numbers makes the economically sound choice clear.
The next post presents some examples of using these Economic Sensitivities to perform simple Economic Analyses to enable objective, economic-based decisions and determine the ROI of many project decisions. (Stay tuned.)
*Note: Often the impact on profit of changes in average sales price is also important, but we have omitted this from the examples above, just to keep it simple. We have also omitted standard Marketing and G&A expenses, which are typically a function of sales and sales price. When these factors are low (< 10% of sales, combined) they don’t have a large impact on the estimates. When they are larger than 10%, they have a greater impact and should be included.
-----
Want to learn more about how to calculate cost of delay? Download the Cost of Delay eBook.

Related Posts
Introduction to Cost of Delay
What is Cost of Delay?
Cost of Delay: How to Calculate It
Cost of Delay and Project Modeling
Cost of Delay Project Model Examples
Cost of Delay Project Modeling Risk
Cost of Delay and Strategic Advantage
Cost of Delay: Project decisions based on profit
8 Ways to Decrease Risk in Project Decisions
14 Tips for Calculating Cost of Delay
WSJF and How to Calculate It
Don Reinertsen on cost of delay
Wikipedia on cost of delay
Guide to Cost of Delay
Editor's note: This post was originally published in 2015 and has been updated for accuracy and comprehensiveness.
