Reports | Embedded Buffer Charts
Playbook Enhancements
- Coming Soon! Buffer Charts are now embedded within Playbook.
- Since all the buffer attributes are defined in the buffer task, all you have to do to show a buffer chart is right-click on a buffer, then click Show Chart.
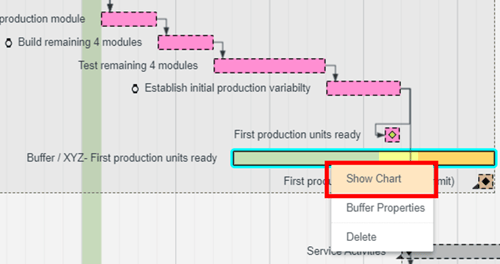
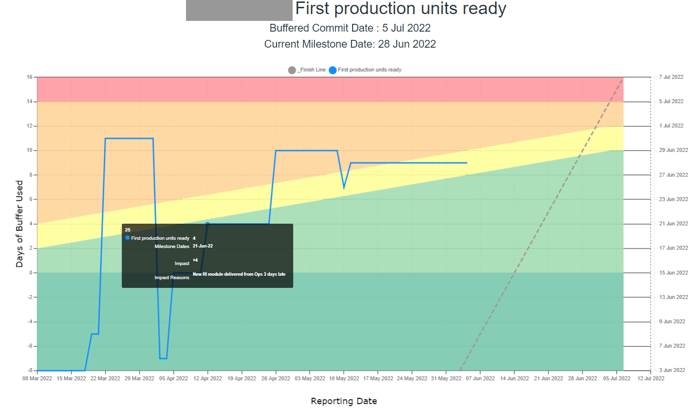
- A separate window then appears with the latest and greatest buffer chart. Impact Reasons are displayed, if any, when hovering over the plot points on the chart.
- Impact Reasons are still defined in the Tracking Milestone's description using the format...
date1 space reason1
date2 space reason2
for example...
5/30/22 Supplier delivery date greater than forecast.
6/8/22 Joseph unavailable for the week as he was needed for production issues.