

With Buffer Charts, project status is clear and have a higher confidence in milestone completion dates. Ultimately you can accelerate the delivery of your projects because you have better control.
The benefits of buffer charts
A buffer is an extra amount of time placed at the end of the project in lieu of padding each and every task. It is a powerful technique from Critical Chain Project Management.
The project completion date (aka promise date, due date, etc.) is at the end of the buffer. A lot of the buffer is expected to be used, but not all of it. The project is completed on-time when all the work leading to the milestone has been completed and the milestone is to the left of the end of the buffer.
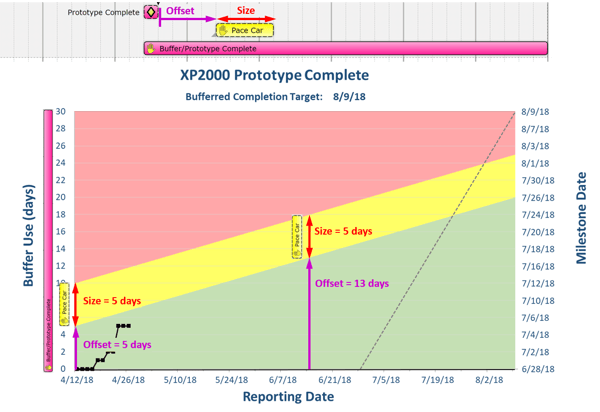
Buffer charts are used to plot the movement of a milestone over time giving an early indication if a project is likely to be on-time or late. Buffer charts also help predict actual completion dates and keep management up to date on the status of the project. In this example, the milestone, Prototype Complete, is being tracked and it has a 30-day buffer as shown on the left, vertical axis.

The team's goal is to keep the milestone in the green area, thereby ensuring the project will be completed on-time. When the milestone is in the yellow or red area, it is time to look for and implement countermeasures to get the project back on track.
In the example below, the project started on 7/1/16. No buffer was used during the first four days of the project, then on the fifth day, one day of buffer was used, then on the seventh day, five days of buffer were used. No additional buffer was used during the remainder of the second week of the project. The project is in the green, therefore the project is currently at low risk of being late.

It is also possible that the buffer is used too fast, too early. If the milestone is in the dark red, all of the buffer has been used, and the project is at an Extreme level and will be late if the team doesn't find a way to regain schedule.

Here is how to create a buffer chart in Playbook.
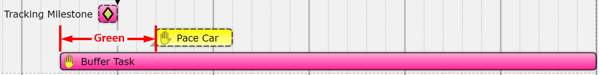
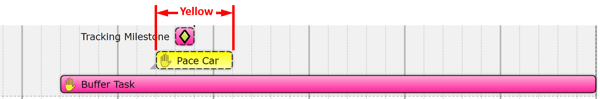
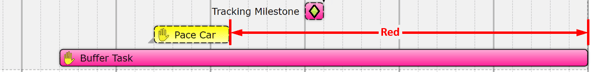
In Playbook, Create a Buffer Task and configure the Tracking Milestone and Pace Car.
Download the latest Excel Buffer Chart template and name it something specific to the milestone/buffer you are tracking.
Open the file and do the following:
> In cell D3, click the green button Connect to Playbook.
> Select the Server Type from the drop-down menu: Cloud server or Local company server. If you don't know if your site is hosted on a cloud server or local company server, contact your Playbook administrator or contact Playbook Support.
> Enter the name of your Playbook Site. For example, if your site is https://xyz.playbookteam.com, enter "xyz."
> Enter your Playbook login credentials and password.
> Click OK.
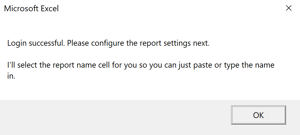
Once you have successfully logged in, you will see the following message.
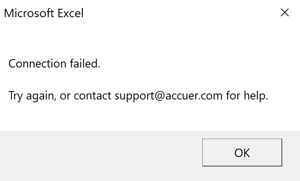
If you are unable to log in, you will see the following message.
In the Configuration Settings section of the Excel file do the following:
>In cell D5, enter the unique value for Buffer Report(must be the same value used in the Buffer Task's description).
> In cell D7, select Report Type using one of the following options:
Designated Milestones/TasksA designated task and its direct predecessors
In this type of buffer chart, the direct predecessors of the designated milestone/task are tracked in the buffer chart instead of the designated milestone/task. In the image below, milestone Ready for Build, is designated, therefore the end dates of its direct predecessors: Back-panel PCBA, Power PCBA, and Enclosure are available to track in the Select Milestones/Tasks to Track section (cell G7). This gives greater clarity to the status of each of the subsystems.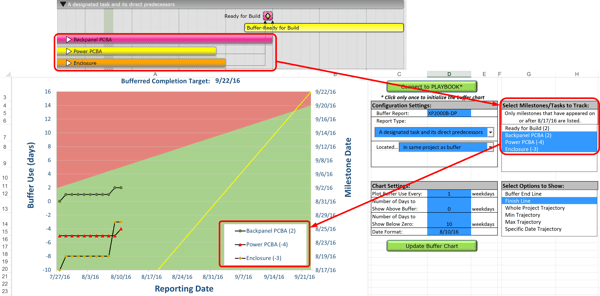
> In cell D8, specify where to look for designated milestone/tasks using one of the following options:
> In cell D17, click the green button, Update Buffer Chart - at this point you should see your buffer chart come to life! Contact Playbook Support at support@accuer.com if you're having any trouble.
The following Chart Settings (cell C11) are used to configure the buffer chart.
Plot Buffer Use Every X weekdays
Number of Days to Show Above Buffer (weekdays)

Number of Days to Show Below Zero (weekdays)
This is used when the milestone/task has moved earlier than the start date of the buffer indicating the project is gaining buffer. Typically, this is set to zero until/if needed.

Date Format

Note: for customers outside the United States, you may need to change Locale (location) to make your date formats work correctly.


Create an Individual task and edit its duration. In the Buffer Chart, the Buffer's duration (size/length) and its start date are extracted from the Buffer Task in Playbook.
Add the following two lines in the Buffer Task's description.
Buffer Report: Unique Code
Tracking Start Date: mm/dd/yy
Unique Code - must be unique to each Buffer Task and is used to link the Buffer Chart to the Buffer Task and its settings (e.g., see the Buffer - Prototype Complete's Description above)
mm/dd/yy - The Tracking Start Date is the day the first task which leads to the milestone is started and actively being worked on. It is the day you start plotting the movement of the Tracking Milestone on the Buffer Chart. It must be in the same format as Date Format in the Excel Buffer Chart.

To set up a tracking milestone, add the following line in the Buffer Task's description.
Unique Code - must be the same value used for Buffer Report in the Buffer Task's description.

How do I configure my buffer chart to look the way I want it to look?
Macros and the various settings in the buffer chart Excel file dictate the following aspects:
If you can't get a look you like, please let us know. We can help customize your macro and/or make it easy to configure in the future. Most of the other aspects of the chart are modifiable in other ways.
Since this is an Excel file, many aspects such as font sizes, colors, and styles can be edited the same way you would format that item in any Excel chart. Right-click on what you want to change and Format Data Labels or Format Axis.
Simply right-click on the area and select Fill and choose the color you like.

In addition to the Buffer Report and Tracking Start Date attributes, you can also specify the following:
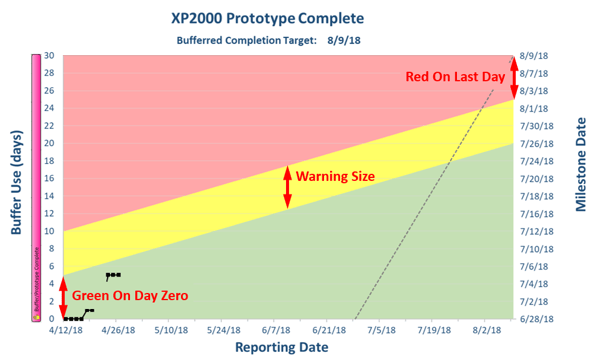 Green On Day Zero: 0.15
Warning Size: 0.15
Red On Last Day: 0.15
Percentages are used instead of days so they can be easily standardized across projects.
