
In general, companies can take two approaches to calculating risk exposure, a quantitative approach and a qualitative one. There are pluses and minuses to each approach. Let’s look at the quantitative approach first, then the qualitative approach.
Calculating Risk Exposure Quantitatively
Risk Exposure is comprised of two independent variables:
- Risk Impact
- Probability that the risk will materialize
The risk impact is the cost to the project if the risk actually materializes. The probability is the likelihood that it will materialize. Risk exposure is the product of these two terms.
Risk Exposure = Risk Impact X Probability
Let's look at an example. In this case, we will use the risk that the product will not successfully pass the final validation and verification test. First let’s look at the risk impact of validation and verification test failure.
If the product fails its validation and verification test, the team estimates it will need another design iteration to fix the problem. The team also believes it will take two weeks to execute the design changes and re-release the documentation, eight weeks to procure parts, and another 2 weeks to assemble the product and repeat the testing.
Total impact = 12 weeks
Next the team needs to consider the probability that the risk will materialize. In this scenario, we estimate that the probability of failure is 25%.Now that we know both the impact and probability, we can calculate the exposure rating.
Exposure Rating = 12 weeks * 25% probability = 4 weeks risk exposure
Interested in understanding more Lean-Agile Principles? Check out our free Lean-Agile training on Playbook Academy such as Rolling-Wave Planning, Applying Agile to Hardware and Critical Chain.
The complexities of Quantitative Risk Analysis
This example illustrates a quantitative risk analysis where we apply numbers and run a calculation. At this point in our analysis we could choose to keep things simple. However, this may render our risk exposure rating inaccurate.
For arguments sake, let’s tease out the possible complexities of quantifying risk exposure. We will use the same example.
In this same scenario, what if the 25% probability of a failure consisted of a 5% probability of needing a 12-week hardware design iteration, and a 20% probability of needing only some software or firmware changes which can be made much more quickly?
In addition, what if the “quick” changes consisted of a 15% probability that the needed changes could be completed within one week and a 5% probability it would take us two weeks.
In this case, then the Risk Exposure would be calculated as:
5% * 12 weeks + 5% * 2 weeks + 15% * 1week = .85 weeks
You can see in this example how quantifying risk exposure can become complicated. There might be many potential scenarios. However, modeling the most likely 3 to 5 scenarios will provide a result which is generally accurate enough.
However, there are other things to consider.

Impacts beyond project schedule
While the impacts of risks are most often to the project schedule, there are risks which impact other economic items including sales volumes, sales price, cost of goods, and project expenses.
For example, an alternative to solving the problems via an updated design, is the option to release the product to the market as-is. In this case, we’d likely suffer reduced sales, either because of dissatisfied customers, or because we had to derate it (i.e., not sell it for some applications because those applications create conditions which result in a failure).
Ultimately, in order to quantitatively assess risks, and set priorities accordingly, we must compare the impact of delay in weeks to the impact of sales in # of units and/or $ per unit, a change in COGS in $ per unit, and project expenses in $.
And…
Before we can compare these impacts quantitatively, they must be expressed using the same unit of measure. e.g., We need to be able to convert sales impact into schedule impact. Or we need to be able to convert all of the impacts into a single unit, e.g., profit.
This conversion is easy if you develop an economic model of the project. (See our posts on developing economic models and understanding cost of delay.) However, because of the complexities involved with multiple potential impact scenarios, and difficulty determining the numbers to apply, most companies choose a qualitative approach to estimating risk exposure.
Estimating risk exposure qualitatively
Because of the complexities of quantitative analysis as demonstrated above, most teams take a qualitative approach. The simplest method for qualitatively rating risk exposure is to use a direct gut-feel assignment of High, Medium, or Low. Impact and probability are still combined to determine the exposure rating, but the combination isn’t done explicitly. We combine the terms in our heads and assign a single result.
Teams just starting to manage risk often start with this very simple approach. It works well enough to determine the relative severity of each risk and to set priorities.
Some teams, however, choose to qualitatively assess impact and probability explicitly. For each term, the team will assign high, medium, or low. A simple matrix is developed to estimate overall exposure, such as:
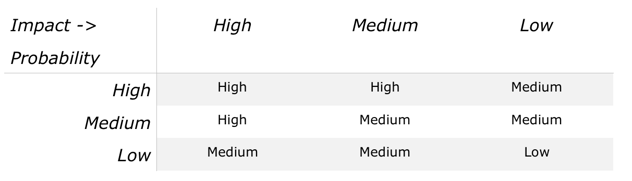
We tend to see this type of risk assessment in companies where it is customary to perform FMEAs (Failure Mode and Effects Analysis) where assessing the impact and probability terms explicitly is standard practice. Project risks (failure modes on a project) are quite similar to product risks (failure modes on the product) and so this approach works well to establish the relative severity of each risk.
Tips for better qualitative risk exposure estimates
Because these assessments are qualitative, the severity is in the eye of the beholder. One person’s medium could be another person’s high, even if they are considering the same impact. Where one person thinks a 6 week exposure is high, another person could assign a medium to a 6-week exposure.
We recommend implementing guidelines to make impact ratings more consistent. For example, if the impact seems like it would be 8 weeks or more, then it’s a high. 4-8 weeks is a medium, and up to 4 weeks is a low.
Similarly, schedule-impacting risks must be balanced against the sales and COGS impacting risks. Using guidelines for these types of impacts also facilitates a more consistent assessment. E.g. Risks with more than a 10% impact to unit sales are rated high, 5-10% are rated medium, and under 5% are rated low.
For COGS risks, for example, more than 20% increase to unit cost is a ’high’, 10-20% represents a medium, and under 10% is a low impact.
Again, the actual thresholds are easy to determine with use of an economic model of the project. For example, is easy to establish that an 8-week delay would cost the business the same amount of profit as a 12% reduction in unit sales or a 22% increase in COGS. Once these conversion factors are calculated, applying them to the risk impact assessment is easy.
Another way some teams choose to improve their process is to rate the terms on a five point scale rather than a three point scale. For example, High, Medium-High, Medium, Medium-Low, and Low. Three points scales (High, Medium, Low) generally result in a lot of High risks, which often obscures the highest risks with others that aren’t as high.

How important is an accurate risk exposure rating?
The answer to this question is, it depends. If you mitigate all of the risks, regardless of their exposure rating, then it doesn’t matter what their exposure rating is. However, most teams don’t mitigate all of the risks, and for good reason. In any project, at least some risks aren’t worth the time and effort required to mitigate them.
The decision to mitigate a risk comes down to comparing the cost of the mitigation(s) to the amount of risk reduction achieved. For example, if we can eliminate a high risk (e.g. 8 week exposure) with only a few days of work, then mitigation makes sense. If we can mitigate a low risk (1 week exposure) with a few hours of work, we should.
On the other hand, if it would take 4 weeks of mitigation to eliminate a low (1 week) risk, it makes sense not to mitigate. In this case, the mitigation costs more than it is worth. Having an accurate exposure rating is important for those risks on the “bubble” – those that maybe we shouldn’t mitigate.
Mitigation planning, provides more information for a better decision on whether to mitigate or not. You can have more confidence in your decision to mitigate or not toward the end of the next step, mitigation planning, where we capture and assess the best ideas for mitigating the risk, and determining that the mitigation is worth it.
Similar to estimating the risk exposure qualitatively or quantitatively, in risk planning we estimate the cost of the mitigation(s) either qualitatively or quantitatively. After planning, risks that make sense to mitigate become more obvious. For the few risks which are still ’on the bubble’ after planning it’s worth the effort to explore the accuracy of the risk exposure rating. It’s worth a little time on a quantitative exposure estimate. Quantitative analysis isn’t overly difficult if you have the right tools and processes, and some practice, and it can help improve our intuition for more accurate qualitative analyses.
In my previous post, I presented a method for estimating a design/technical risk’s impact by using the lead time of the impacted component (impacted object). For a quick estimate, this works well. However, impact estimates can be more accurate IF you have a good model of the project and a way to assess specific scenarios within that model.
With traditional project schedules, where tasks are weeks long and don’t accurately reflect the resource utilization and true critical chain, it is very difficult. However, with Playbook we can develop a much better model of a project, because the model has a higher resolution, and is built and updated by the team members who know what needs to happen at a detailed level. A more accurate model means our assessment of a risk’s potential impact on the schedule is also more accurate.
Watch the Video: Risk Management
Conclusion
As you can see, there are a lot of subtleties in assessing risk exposure. I’ve left out many details. For more information, I’ll refer you to any of the dozens of books on the subject, such as Preston G. Smith and Guy M. Merritt's book, Proactive Risk Management.
Download a free risk exposure spreadsheet to get you and your team started!

Related Posts
Risk Management and Project Objectives
Risk Identification and Capture
Risk Mitigation Strategy (part 1)
Objects Impacted and Modular Architecture
Calculating Risk Exposure and Free Risk Exposure Spreadsheet
Risk Mitigation strategy (part 2)
The Risk (Learning) Management Process
1. Identify
a. Briefly describe the risk
b. Give it a short name
c. Assign it an owner
2. Analyze
a. Determine/Document the risk drivers
b. Evaluate impact, probability, and exposure
c. Establish value rating (High/Medium/Low)
d. (Sometimes) merge with or supersede another risk
e. (On rare occasions) determine it is invalid
3. Plan
a. Evaluate mitigation options and determine which mitigations to implement
b. Establish a detailed mitigation plan, integrated with the overall project plan
c. Establish burndown milestones (Milestones after which we re-evaluate the status and rating of the risk.)
d. (Sometimes) decide not to mitigate the risk, because the mitigation cost is too high compared to the value
4. Implement
