
Here is a simple formula for quickly estimating Cost of Delay: the profit lost per-month of delay.
Total COD = Lost Month Cost + Peak Reduction Cost.
In order to calculate the cost of delay, we need to understand the behavior of the product life-cycle, and the impact of launching late, on total profit. In this post we will discuss the product life-cycle, and how to estimate the Total Cost of Delay quickly.
The Cost of delay over the product life-cycle
Recall from Part 2 the graph below, which shows Cost of Delay over an entire product life-cycle.
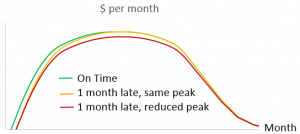
Figure 1: Monthly profit, projected for entire life-cycle, on time vs. 1 month late
In order to estimate the cost of delay, we need to consider the behavior of the curves depicted in the graph above and the variables that can impact their shape.
First let's discuss the front end of the curves, the product launch and sales ramp-up period.
Notice the ramps on the left for the orange (one month late) & red curves (one month late with a reduced sales peak) are about the same slope as the green curve (on time to market). The ramp is shifted to the right, but the slope is the same. The slope reflects the rate of sales, which is determined by the rate at which our sales force can get up to speed on the product, advertise it to customers, win them over, and ultimately achieve sales.
Generally, the rate at which sales increase is about the same whether releasing on-time or late. Pent-up demand scenarios where the slope gets steeper if we release later, are rare. It is more likely that the ramp gets shallower if we are late, because it becomes harder to win those customers over (from the competition).
One can argue it is possible to increase the slope by adding sales people or spending more money on advertising. However, if increasing sales this way is cost effective if we are late, why wouldn’t we just plan to do the same on the "on time" curve too?

Delaying launch reduces profit
Next let's look at the top of the curve - orange curve vs. red curve. In most cases, the later we are to market, the lower our sales peak will be. There are several reasons for this.
First, during the time we are still in development, our competitors may be out there advertising, talking to customers, and winning them over. Some of the customers they ‘win’ will typically continue to buy from our competitor, even when our product is released, and even if our product is better than our competitor’s.
Next, even if our competition hasn’t launched yet, they are getting closer to it. With each passing week we lose more of our opportunity to win customers who will stay with us even after the competition launches.
Finally, the market for the product may be seasonal or event driven. If we are late to market, the seasonal rush may be partially or completely over, or we may miss a trade show, or a sales meeting, and lose the associated buzz that comes with it.
These cases are common. As a result, our peak monthly profits are reduced because either our sales volumes are reduced, or we lower the sales price and reduce our margins, or both. Unfortunately, the amount of the reduced peak is difficult to estimate. To make matters worse, some people have a hard time accepting that there will be any reduction in the peak at all. Instead, they choose to believe that if (whenever) we build it, they will buy (eventually), at the same price.
When the product life-cycle extends beyond 5 years, it is common to assume that every customer lost as a result of being late to market will be back to buying from us by year 2 or 3. This is not the case. The only way to catch up when sales are still increasing is to increase the slope of the ramp via additional investment in sales and advertising. As discussed previously, if this additional investment is cost effective, it should be in our baseline on-time curve as well.
First to market increases profit
Now that we have looked closely at the ramp-up and top of the curves, let’s look at the tail of the curve – the declining profits period.
If you forecast far enough to have a downslope, the downward ramps for both the on-time product launch and the late product launch are typically (almost) coincident. Think about why you have declining profits and ask yourself, “Does the downslope start later if I release later, or does the rate of decline change if I release later?” Not likely. Usually the reason for the declining profits is that our competitors will launch a better solution around that time.
When new competition arrives, either our volume drops or our margins do, or both. If we release our current product later, in today’s competitive marketplace, the downslope typically remains unchanged. There are exceptions, but they are rare.
Estimating the lost month cost
When forecasting for an entire product lifecycle, if the ramp-up and plateau area (profit) moves to the right, as shown in orange below, and the decline area in yellow stays fixed, we lose the month in between – the peak month of sales. In fact, the green and blue areas in the graph are equal. Even if you don’t forecast for the entire lifecycle, if you forecast far enough to reach declining profits, the downslope is fixed, the ramp-up shifts, and you lose a peak month of profit. This Lost Month Cost is some of the COD. The peak month of volume times the product margin is often the easiest way to calculate it.
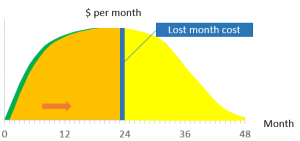
Figure 2: Lost Month Cost of Delay, sales projected for an entire lifecycle.
When we don’t forecast as far as the downslope, and sales are still increasing or have plateaued or peaked at the end of the Value Horizon, the ‘tail’ is a drop-off. The last month’s profit, shown in blue below, falls out of the Value Horizon window.
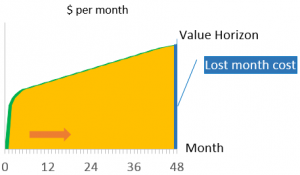
Figure 3: Lost Month Cost of Delay, sales still increasing at value horizon
It may seem initially like we don't really lose this month of profit, but that it has just shifted one month later. However, if we zoom-out from the curve and forecast further, until sales do decline, it starts to look like the whole-lifecycle curve. The left side (orange area) is shifted and the right side (yellow area) stays fixed and we lose the month between, which is right before we start declining – the peak month.
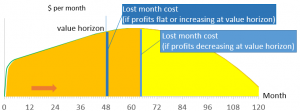
Figure 4: Lost Month Cost of Delay – partial life-cycle vs. entire life-cycle
There certainly is a cost of delaying your market launch.
For example, if the volume will peak at 200 units per month, and our profit margin is $2000 each, the lost month Cost of Delay is $400K. Of course, your volume and margin may vary from this example.
Generally, once this concept is demonstrated graphically, project teams agree with a shift in the front-end, a fixed back-end, and the peak month of profit over the forecasted period as a simple, probably conservative estimate for Cost of Delay. If you don’t count any peak reduction, this is your per-month Cost of Delay.

Estimating the Peak Reduction Cost
Determining a number for the reduced peak in profits is, unfortunately, not straightforward. It is too easy to discount the original marketing forecasts and without a solid baseline to measure actual sales against, we can’t estimate what sales would have been had we been on-time. (If I only had a nickel for every time I’ve heard someone say, “The marketing guy was smoking something when he came up with those numbers.”) The reduction in peak for many is too much of a fuzzy guess. Fortunately, coming up with a number for the reduced peak it isn't entirely necessary, as we discuss later in this post.
Although it is difficult to have confidence in the peak reduction value, there is a simple way to estimate the additional Cost of Delay due to a peak reduction. As shown in purple below, imagine a strip of area (sales profit) X% wide and as long as the forecast, where X is the peak reduction in volume or margin percentage. Values for the peak reduction are typically 1% to 5%, though it can be much higher in some cases.

Figure 5: Peak Reduction Cost
A simple estimate for the area of this strip is its average width times its length. The average width is the X% peak reduction * the average monthly profit over the forecasted time period. The length of the strip is the number of months in the forecasted time period. So Peak Reduction Cost = X% * average monthly profit * number of months forecasted. Average monthly profit is average volume (total volume divided by the number of months forecasted) times the product margin, if margin is fairly constant over time.
For example, a 2% reduction in average volume of 150 units per month is an average reduction of 3 units a month. Over a 4 year (48 month) period, we’ll sell about 150 fewer units. With a margin of $2000 per unit, that is a Peak Reduction Cost of about $300K.
As you can see, the Peak Reduction Cost can easily match or be even larger than the Lost Month Cost, especially on products with long lifecycles.
The Total Cost of Delay
Once you understand how to calculate the cost of one lost month and the peak reduction, the total COD can be easily estimated.
Total COD = Lost Month Cost + Peak Reduction Cost
In conclusion, even though you can easily estimate the Peak Reduction Cost, and it can easily double or triple your total Cost of Delay, people typically can’t agree on what the peak reduction percentage ‘X’ should be. As a result this component of total Cost of Delay is often ignored.
Fortunately, the Lost Month Cost is typically enough to establish Cost of Delay as a valuable, understood, and agreed-to metric within your organization. And it is still generally a large enough number to have the impact that an even larger one would have. It can still lead to reducing batch sizes, building more resource availability and capacity into the development system, and throttling demand. In addition, Cost of Delay gives project teams the ability to analyze trade-offs objectively, which can really help speed up decisions, and therefore the project.
This is part of a multi-part series on Cost of Delay. In this post we will discussed how to estimate the per-month Cost of Delay for a new product development project.
Stay tuned for Part 4, where we discuss how to quickly estimate the other inputs generally required to perform a quick economic analysis.
Related Posts
Introduction to Cost of Delay
What is Cost of Delay?
Cost of Delay: How to Calculate It
Cost of Delay and Project Modeling
Cost of Delay Project Model Examples
Cost of Delay Project Modeling Risk
Cost of Delay and Strategic Advantage
Cost of Delay: Project decisions based on profit
8 Ways to Decrease Risk in Project Decisions
14 Tips for Calculating Cost of Delay
WSJF and How to Calculate It
Don Reinertsen on cost of delay
Wikipedia on cost of delay
Guide to Cost of Delay
Editor's note: This post was originally published in 2015 and has been updated for accuracy and comprehensiveness.
