
A fundamental principle of Lean is smooth, continuous flow. Flow is achieved by eliminating turbulence caused when the flow through any process is stopped because a resource is busy doing other things. Such interruptions can cause the flow of work to stop, resulting in work queues.
What is a queue in Lean project management?
A queue is where tasks sit idle waiting to be worked on, and the time they spend there is called queue time or wait time. The duration between starting a task and completing a task is called execute time. In traditional product development, wait time is typically much greater than execute time.

Figure 1: Total Duration
For example, a change order often sits in an approver’s inbox for days, when it only takes a few minutes to review and sign. These queues and delays build up across the whole system of tasks and resources, from the beginning of a project to the end, and make our projects take much longer.
Examples of other queues in Lean project management:
- An engineering change order waiting to be reviewed and approved.
- Parts waiting to be inspected.
- Information waiting in someone’s head to be shared with someone that needs it – e.g., What are the test results?
The longer the total duration of each task, the longer each project takes. Queue time is a big component of the total duration of each task, and the overall lengths of our projects.
That is NOT to say, and I cannot emphasize this enough, that we should start executing each task as soon as it arrives just to reduce queue time. This is often more detrimental to the throughput, as multitasking easily extends the time to execute well beyond what we save in wait time. We will discuss this more when we get to the post about pull vs. push.
However, wherever we can reduce queue time without extending execute time, we reduce the duration of our project. One of the keys to accelerating projects is finding ways to do this. The first step is to make the queues visible.
How to calculate queue time
Total Duration = Wait + Execute
The ability to see queues is critical
For the sake of this and future discussions, I’ll present a simplified view of a resource in a typical hardware team, where there is a mix of projects currently being executed.
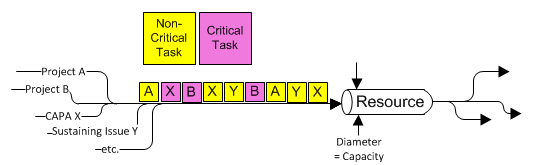
Figure 2: Resource Queue
The diagram above focuses on a single component of our system – a single resource. The work is represented as discrete critical and non-critical tasks in the form of stickies (the yellow and pink boxes). Tasks sit in the resources queue until the resource starts to work on them. They are then placed in the “Resource” pipeline of active work.
In later posts we will enhance this diagram and look into the pipeline, as well as represent more real life conditions, but we have started the discussion with this simplified view to make one very important point: the real priority of each task varies. We will discuss priorities more in a later post. For now, we’ll keep it simple and note that some tasks are ‘critical’ and some are not. ‘Critical’ means that a delay of the task will probably cause a delay in the project.
Every day a critical task sits in a queue is another day of project delay.
Again – this statement assumes that the resource doesn’t start working on the tasks as soon as they arrive and multitask just to get them out of the queue. Multitasking causes the durations of all tasks to get much longer while they are in the resource pipeline as we will see in later posts.
Queues can also be visualized using a Cumulative Flow Diagram (CFD).
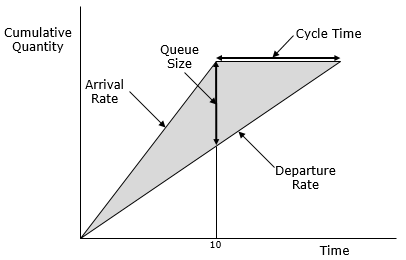
Figure 3: Cumulative Flow Diagram
For example, let’s say this CFD represents drawings entering document control for release. If the arrival rate is 2 drawings / day and the departure rate is 1 drawing / day, the 20th drawing, which appears in the queue on day 10, will have 9 drawings in front of it. It will wait in the queue for 9 days and be completed 10 days after arriving. We can predict this by seeing the queue.
As the CFD shows, queues are a leading indicator of the completion date of each task, as opposed to the lagging indicators of missed deadlines and project schedules published with the completion dates moved later. When we can see the queues, we get information early enough have A LOT more opportunities to keep the right things moving. When we can’t see the queues, delays are unavoidable, which is the world we live in without Visual Work Management.
How do we minimize queue delays?
The good news is that queues, if they are visible, can be effectively managed and doing so will accelerate project execution. In order to clear a queue, we can use a combination of four effective strategies:
1. Slow the arrival rate by throttling demand
2. Increase departure rate by increasing the availability/capacity of the resource
3. Move some work to a more available resource
4. Remove the work entirely – just eliminate and/or cut work from some tasks
Without some visibility of the work and the queues, how can we even hope to execute these time-saving measures quickly enough to avoid delay? We can’t, not compared to how effective we can be when we can see the queues.
Note – that ‘just work faster’ and ‘apply more pressure’ are not listed as options for increasing the departure rate. We cannot clear a queue by increasing the pressure to force the work through the pipes. This directive often backfires by encouraging people to multitask and take too many risks or make more errors. We will discuss this more in a follow-up post on push and pull.
Besides the clearing strategies above, the other tactics to minimize queue time prevent the queues from getting long in the first place. I will summarize these methods here, as we will be diving into these in later posts.
1. Reduce resource overloading
2. Reduce variability in arrival rate and work amount
3. Reduce batch sizes (those stinking batches again)
4. Limit Work In Process & multitasking
Visual work management and queues
Most forms of visual work management help make queues at least a little more visible, and some do a better job than others. Almost all of them obscure the real queue with tasks that aren’t really there yet.
This is an important but subtle part of the definition of a ‘queued’ task. A task is only in the queue when it is ready to be worked on. This only becomes the case, generally speaking, when all of the tasks that must precede it are complete.
For example, a shopper walking around the grocery store still picking out their groceries is not yet in the checkout line queue. A test that can’t be run because the test units aren’t built yet isn’t really in the tester’s queue either. A task that can’t be started yet isn’t technically in the queue. Most forms of VWM miss this important point entirely.
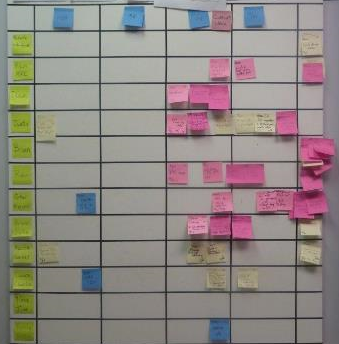
Figure 4: Wall Gantt
Wall Gantts are not very effective at making queues visible. Many of the stickies (tasks) on the resource’s row have incomplete predecessors, which makes the actual queue size difficult to identify. There are work-arounds, such as adding a queue dot to the sticky, but these techniques are difficult to sustain.
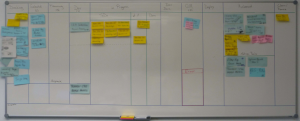
Figure 3: Process-specific Kanban Board
If set up properly, a process-specific Kanban, can be a little better at showing queues, but not necessarily the ‘resource queues’. Instead, these show what I call ‘lifecycle queues’. For example, there can be a few stickies waiting in the ‘ready for system test’ column which lies just before the ‘in system test’ column.
The problem is that very often a resource will have tasks spread across many different lifecycles on many different project boards, as we discussed in the previous post. With this approach, we still lack clear visibility to the work that each resource has on their plate across all projects.
In most hardware development teams, because the resources are so specialized and there is a high mix of different types of projects and sub-processes, good visibility to each resource queue is essential. Without this visibility, each resource’s priorities are less clear and it is more difficult to determine when each task will be completed and when queue clearing measures are necessary.
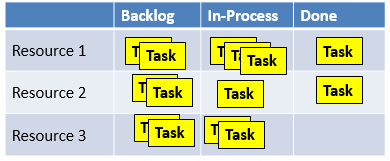
Figure 4: Generic Kanban Board
The ‘To-Do’ or ‘Backlog’ column in a generic Kanban approach is usually a little better view of the resource queues. However, the same issue usually exists -- some tasks in the To-Do column are not ready for execution because of incomplete predecessors. This again obscures the real queue. Also, the resource queue is difficult to see across projects if those projects are spread across multiple boards, which is most often the case.
This is yet another example of how the tools that evolved in software development miss the mark for hardware teams. In software development, dependencies between tasks are far fewer and less complex than in hardware projects. Generally, most software tasks are already in the queue by the time they are added to the project boards. The few dependencies that exist are easy enough to manage ad-hoc.
Queue visibility
There are other important aspects to good queue visibility in hardware teams, which most other formats and tools miss. First is the importance of seeing the queues, not only on a task basis, but also in the amount of work in the tasks. Three tasks in a queue could be three days of work, or thirty days of work.
Unless we can see the amount of work in the tasks, completion dates are difficult to determine and we lose the ability to know when to execute a queue-clearing measure. To make matters worse, inaccurate expectations for task completion dates too often result in additional push from management, which causes a number of problems we will discuss in the push vs pull post.
Additionally, especially with physical boards but even in digital sticky tools, seeing the work in a resource’s queue across all activities is difficult. If the tool does not enable us to manage sustaining engineering, CAPAs, early concept design and learning phases, and even training, annual reviews, and any other tasks which are in our queue, we simply can’t manage the queues as effectively.
Finally, queue visibility is enhanced by granulizing the work well. Rather than one big, multi-week task with a lot of hidden subtasks, we benefit by granulizing and showing the subtasks when we can. There are many good reasons for task granularity, and making the resource queues more visible and manageable are only a couple.
However, to get good granularity and effective queue management, the people who know the work must be the ones to plan the work. To achieve optimal queue manageability, the tool must be easily usable by the whole team. It can’t just be the project manager's tool.
Playbook makes queues visible
Queue visibility is a key differentiator of Playbook. The resource queues in Playbook are highly visible – across all resources and activities, as well as across projects.
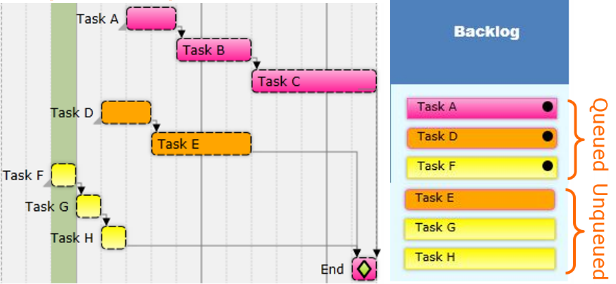
Figure 4: Playbook Resource Queues
If the predecessor is complete, then everything required to start the task is complete and the task is ‘queued’ as indicated by the black queue dot. In views for the standup meeting, and in the view which spans all projects and activities, anyone can see the current queue for any resource(s) they select.
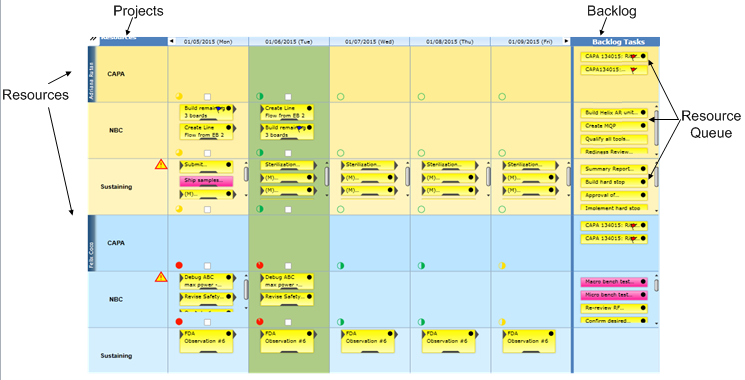
Figure 5: Playbook Resource Queues across projects and resources
Work is visible on the tasks when desired, and the tasks have good granularity because the whole team can easily use the tool. I could go on, but this series is about the underlying principles and conditions of hardware development, so let’s get back to talking about the system we are trying to improve. If you would like to know more about Playbook and queue management, please do not hesitate to contact us.
In the next post, Part 5 we look at the enormous impact of resource overload and variability on product development systems.
Thank You and credit to Don Reinertsen who introduced us to the power of watching and managing the queues, and a great many of the points I will be making in this series.
What is the number one cause of project delays? It's not what you think. Watch this 9-minute video to find out what is.

Related articles
Lean project management
Lean project management methodology
Lean project management Kanban
Lean project management principles
Resource management
Pull vs. push
Task management
Shared project buffers
Decentralized planning
Daily stand-up meetings
Guide to Lean Project Management
