
In a previous blog post I explained (and hopefully convinced you) that measuring “percent complete” literally causes your projects to take longer.
There’s another report that we’re getting asked for more frequently that isn’t very useful for hardware projects. It’s the “burndown” report that is used in software development. It’s a fairly simple report and somewhat useful for software, but it doesn’t make sense for hardware and I’ll explain why.
In case you haven’t seen one before, I’ll briefly explain it using a two-week software sprint as an example.
The horizontal axis is time and the labels are dates or days of the sprint.
The vertical axis is “points”. (Scrum teams estimate the effort of their work in “points”, which I’ll explain in a bit.)
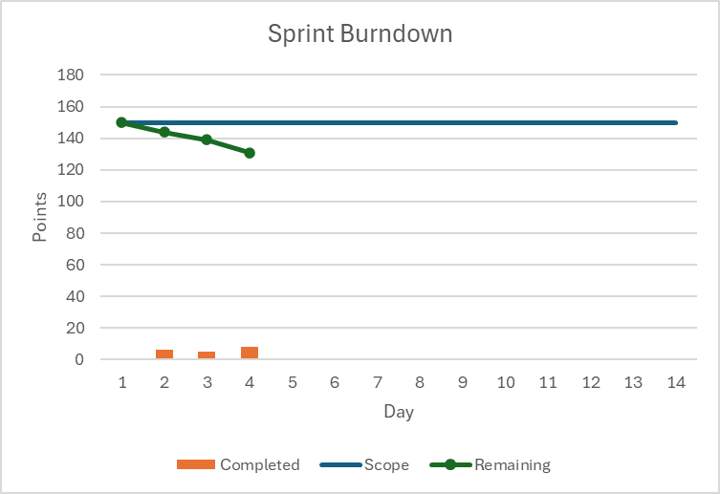
The blue line at the top (Scope) shows how many points there were at the beginning of the sprint.
The orange bars at the bottom (Completed) show how many points were completed on each day.
The green line (Remaining) shows how many points are remaining at the end of each day.
Once you’ve plotted a few days of progress you can estimate an average slope (points per day) and you can project this into the future and predict when you will be done.
But it’s normal that it takes a day or two for the first stories to get completed, so it’s likely that the slope of that line will change during the sprint and your chart will look like this when you’re done.
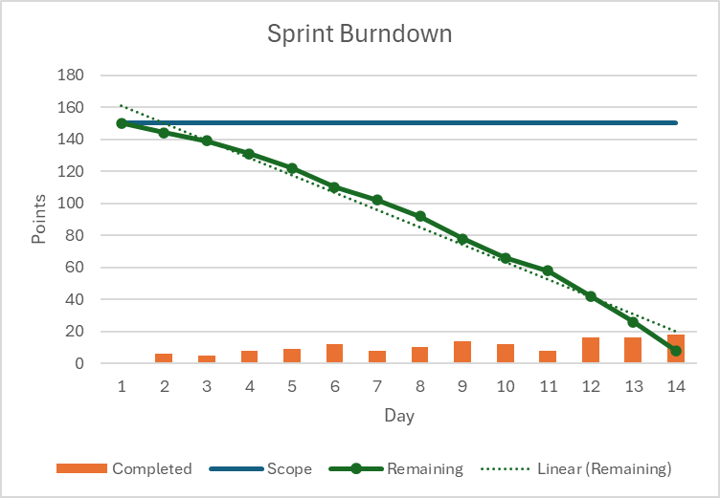
So you can add a line to show the overall average and this can be used to estimate the “velocity” of this team.
Even though points don’t translate directly into hours, they can quantify the relative effort required to develop each story. And the team can add them up to decide how many stories to take on into the next sprint they are planning. And once you know how many points can be completed in a sprint, you can estimate how many sprints it will take to complete something larger such as a product, project, or epic.
So a burndown chart can be used to predict the end date of software projects.
Predictable end dates are the number one goal of our customers, so this is a good thing. But as I mentioned, it doesn’t work very well for hardware projects.
And here’s why…
Burndown Charts Requirements
For this to work, the skills of the team members need to be fairly similar or homogenous. If there was one team member that had a unique skill and was the only person that could do some of the work, it’s possible they would be holding up progress while the rest of the team was sitting idle. (Yes, you could have different types of work and have team members for each specialty, but this adds complexity to this process and starts to make it less effective.)
Second, all of the work needs to be completed by the team without external wait time. If any of the work required a long testing cycle or had a lead time for ordering something, that time would not show up as something that would impact the end date. (In other words, the “points per day” metric would not be consistent for that work.)
Finally, sprints don’t work very well for tasks that cannot be completed within the length of the sprint. You don’t get to record the points until the work is completed so you would have done part of the work in one sprint, but captured all of the points in the next sprint when it was finished. (Again, throwing off the slope of the “remaining” line…)
Hardware Development Projects are Different
You can see that hardware teams don’t meet these requirements. The teams are made up of very diverse skill sets, a lot of the work has wait time in it, and many of the tasks cannot be completed within a two-week period (e.g., procurement, testing, etc.)
The diverse skill set creates a few problems. First of all, that means the person doing the work is the one that will have to estimate its effort—the estimating can’t be done by the team or a non-subject matter expert (SME) who doesn’t know how long it will take.
And the amount of work required by these SMEs can vary a lot during different phases of the project. So it’s very common for hardware teams to have a critical resource constraint during the project that directly impacts the schedule for a long period of time. (For a great example of this, see how this company went from fourteen months late, to four days early.)
Lead times or wait times cause problems because they are going to take longer to complete than they would just based on their level of effort. They will span many days in the plan, but not require effort every day from the resource that is assigned to them.
So their ‘duration’ is not a function of their ‘effort’.
This is why we use both variables in Playbook projects. It may sound like more work to capture both variables, but most people think in terms of both when they are creating an estimate anyway, so it really isn’t more effort.
And because both variables can have a big impact on the end dates, it makes the project plan a lot more accurate.
There is one more thing that happens on hardware projects that make burndown charts inaccurate. Since the slope of the line is based on how many people are working on the project, it will change significantly when people drop off—like they do at different times in hardware projects.
Because the roles and team size change in different phases, you can not predict a distant end date based on a “rate of progress” in an earlier phase of the project.
In other words, “hours burned” is not a very useful measurement.
Work Burndown is Still Used in Some Cases
There is one time that tracking hours burned is necessary and that’s for projects that are based on “earned value” or time and material costing. In that case Playbook can report “hours worked” with 15-minute accuracy at any time with the push of a button. It doesn’t require anyone to enter or manipulate data before they do so. And the time can be reported by individual, resource type, phase, summary task, milestone, etc.
Some parts of Sprints do work in Hardware
Tracking hardware projects with software burndown charts is another example of using the right tool for the right job. Just because something works somewhere, doesn’t mean it will work everywhere. But that doesn’t mean none of the concepts or principles will apply, so it’s important we look at the details and evaluate them separately.
Focus and Fast Feedback
By chunking software projects down into sprints, you are giving your teams a chance to focus and build something of value that can be demonstrated for customer feedback very early and often during the project. Doing this rapidly is a very important goal of both Agile and Lean.
The corollary to sprints in software is rolling wave planning in hardware. Instead of sprint planning, the teams do rolling wave planning every week or two (the frequency depends on a lot of things: phase of the project, frequency of changes, etc.) During these sessions the task owners review the next couple of weeks in detail and look for ways to shorten the schedule. And they look into the future to add details to the high level estimates that were made previously. This ensures that the critical path is correct, and everyone else has correct priorities so they can focus on their work each day.
And because there's no rule about finishing work in an artificial time boundary, the team never has to stop and start like they do for Scrum. And they can work on things that would span multiple sprints.
Daily Standups
The other valuable idea from sprints is the daily standup meeting. In Scrum, each team member shares what they worked on yesterday, what they plan to do today, and if they are blocked for any reason.
This helps to achieve "flow" which is the maximum velocity a team can achieve sustainably. (For a great book on this topic, read Don Reinertsen's Product Development Flow: Second Generation Lean Product Development.)
In hardware, you can have the same standup meeting and get a lot of benefit from it. However, if you happen to be using Playbook, the standup meetings are shorter because "what you did yesterday" and "what you are going to do today" is instantly visible and obvious to everyone. And so is whether you are blocked or not.
They are more effective because Playbook ensures that everyone has not only clear priorities, but correct ones as well.
If you would like to see a short demo that highlights a standup meeting board for hardware, watch this demo.

I will write a future post about useful reports, but if you would like to learn about them before then, you can watch Chapter 4 of this four-part demo series.
If you have any questions or would like to discuss any of the project delivery challenges you’re facing, schedule a call with me.
Good luck, and hopefully these insights will save you from using another report that doesn't work very well for hardware projects!
