
The goal of developing new products is profit. And even though we intuitively know it's important to get to market sooner, do you really understand the actual cost of being late? In most cases, the profit loss is much larger than you think.
Here is a video that will show you how to calculate the cost of delay as well as a free Excel spreadsheet for calculating the cost of delay to get you started.

Why cost of delay is important
Most people are generally aware that their company wants to develop products faster. If you get to market first, you’ll usually sell more products and at a higher margin than someone who gets there later. And if you can iterate faster, after a few product releases, you’ll have the dominant product in the market.
That makes sense intuitively, but most people I talk to don’t know the actual value of going fast, or the inverse, how much it costs to be late.
It’s true, you can tell teams to hurry because time is important, but something changes when they know the actual dollar value of being late.
And there are other benefits to knowing your Cost of Delay.
For example, when two projects are competing for the same resource and one has to be delayed, everyone can agree which product has to wait, and it’s not decided by which program manager has the most influence.
It also allows teams to know when it’s smart to pay extra to expedite things that are truly impacting the schedule.

But those are just the obvious answers. In a later blog we will create a Project Economic Model which analyses the economic sensitivities of three other project variables that impact our lifetime profit: project expense, product cost, and sales performance.
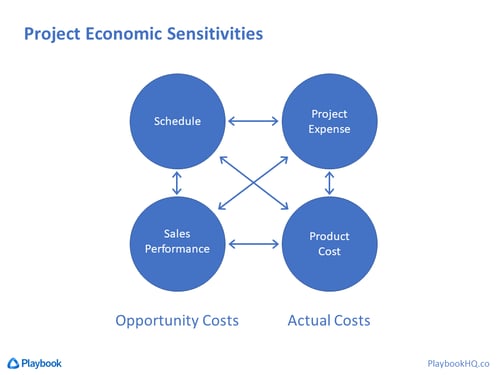
Once you know those, the teams can make tradeoff decisions regarding things like scope, resources, design decisions, and schedule, all in relation to a common variable—which is their impact to profit. That way, not only are better decisions made, but they’re also made faster and without any hassle.
By the way, do you know the number one reason behind project delays? It's not what you think. Watch this short video to find out what is.
The history of cost of delay
Don Reinertsen is our favorite author on all things related to Lean NPD. In 1983 he was a consultant at McKinsey where he did a study and then wrote an article where he stated that “Six months of delay can reduce a product’s life cycle profits by 33%.” He later co-authored a book with Preston Smith where they showed how to calculate this.
The book is called “Developing Products in Half the Time”, and the spreadsheet template came from chapter two in this book. However, in Don’s second book called Managing the Design Factory, he went into more detail on various delay scenarios that we'll cover below as well.
By the way, either book is really good, but if you only have time to read one, I’d get Managing the Design Factory. We used to hand it out as part of our lean product development training because it’s the best introduction to many of the most powerful principles in Lean NPD.
What is cost of delay?
Very simply, Cost of Delay is the amount of profit you’ll lose if you’re late to market with your product. The units are dollars (or whatever your local currency is) per unit of time. If the unit of time is not labeled or stated, it’s usually one month. And this number is unique for each product a company makes.
For example, "The Cost of Delay for Product X is $470,000 per month."
Remember, this is profit, not revenue.
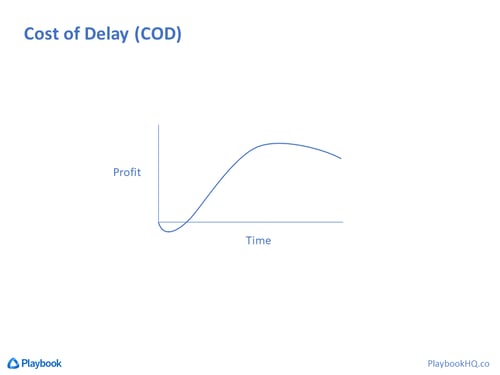
If you’re wondering how the number can be so big, you’ll see when we develop the spreadsheet, but for now I’ll show you a simple graph. The axes on this graph are profit and time. So the profit for the lifecycle of the product might look like this if we include the time prior to launch when we’re spending money on development.
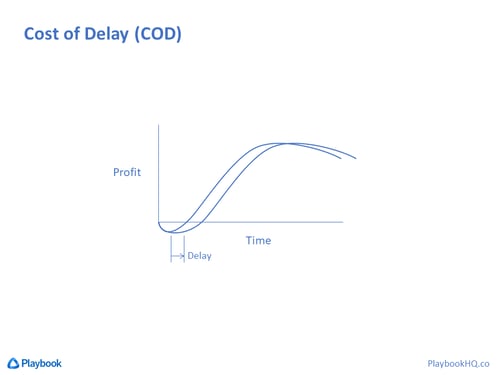
So, when a product is one month late to market, you might be tempted to think that we just lose the sales from that month, and our sales curve shifts to the right one month.
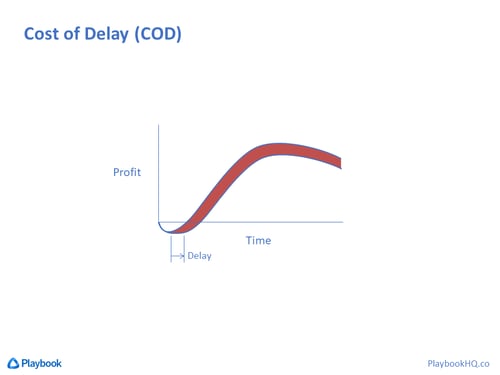
But that’s rarely the case. First of all we spend more time, and money, to get it launched, and then when we do ramp up, we usually don’t get to the same sales volume we would have, so we lose the difference between these two curves for the entire life cycle of the product. And you’ll see in a minute that can be a lot of money.
How to calculate cost of delay
We have blogs and ebooks that cover the advanced details on Cost of Delay, so we're only going to develop the basic spreadsheet here.
All you need to do is create a simple set of projections for your unit sales, sales price, unit cost, and development expense and marketing expense. Enter those in a column for each year you plan on selling the product, and make year one the first twelve months after your initial sales. Since your development expenses happen in the year (or years) before you start selling it, be sure to include a column for those years prior to launch. You can also add your Sales and G&A expense. This will make the numbers a bit more accurate. We don’t want to make this too complicated so it’s usually ok to just add them as a percent of sales.
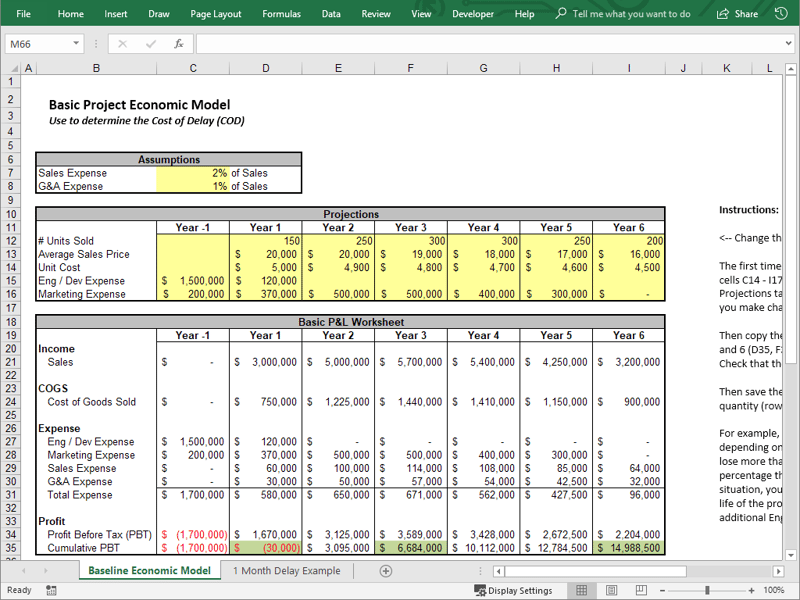
Be sure to talk to each department to get their numbers. If your company has never done this before, they might be surprised that you’re asking for these numbers, but they should have them. Be sure to explain what you’re doing and why, because later on their buy-in is going to be important when we start using this model.
Once you have these, you can create a simple Profit and Loss section. All of these numbers are calculated from the Projection numbers in the yellow cells. These formulas are straightforward. Sales revenue is the number of units times price, cogs is the number of units times cost, etc.
Then at the bottom, show your profit by subtracting your cost of goods and total expense from your sales revenue. To keep this simple it’s a good idea to leave taxes out of this and note that in the row label.
Finally, create a bottom row showing the cumulative profit before tax by adding the profit of each year to the total cumulative profit from the prior year. This row is where we’ll get our numbers for the Cost of Delay.
Just to make this easier to read, we copy the cumulative lost profit for years one, three and lifetime into a Summary table. These numbers are copied values so they stay the same when we make changes later. Then create two more columns for the New value and the Change amount. The New column values are links back to the cumulative profit cells, and the values in the Change column are the difference between the New and the Baseline. This way it’s easy to see the change in profit when you model your one-month delay.
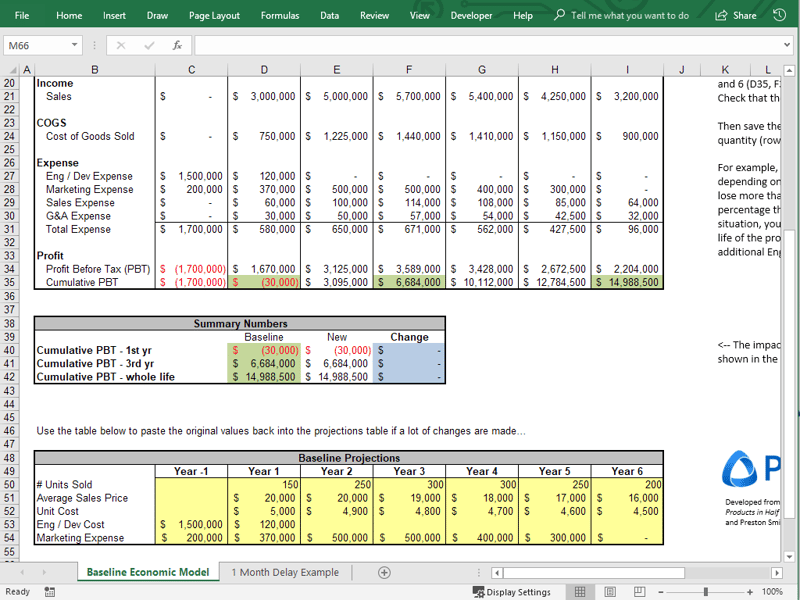
It's also a good idea to copy and paste the original Baseline Projection numbers into a table at the bottom so they’re easy to get back after you have made a bunch of changes above.
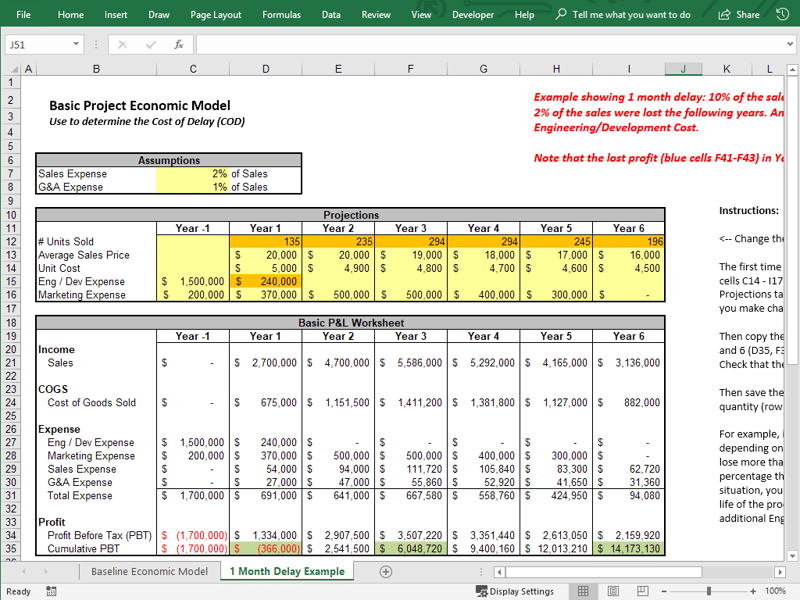
Once you have your baseline profit numbers, you can model a one-month delay. This is another place where you’ll want input from sales and marketing on what they think the lost unit sales will be. Later I’ll show some various market scenarios that you can use as a guide but for now let’s assume a one-month delay will cause a 10% loss the first year. That’s easy to assume because one month is just over 8% of the year, and unless you’re in a monopoly market, you’ll probably lose more than that. And to remain conservative, let’s assume a 6% loss the next year, and then a 2% loss for each of the remaining years. And because we worked an extra month, our R&D costs increase by that amount. Now you can see the changes in orange in the image below.
Now we can see that our the impact of the one month delay in the blue cells of the Summary table…
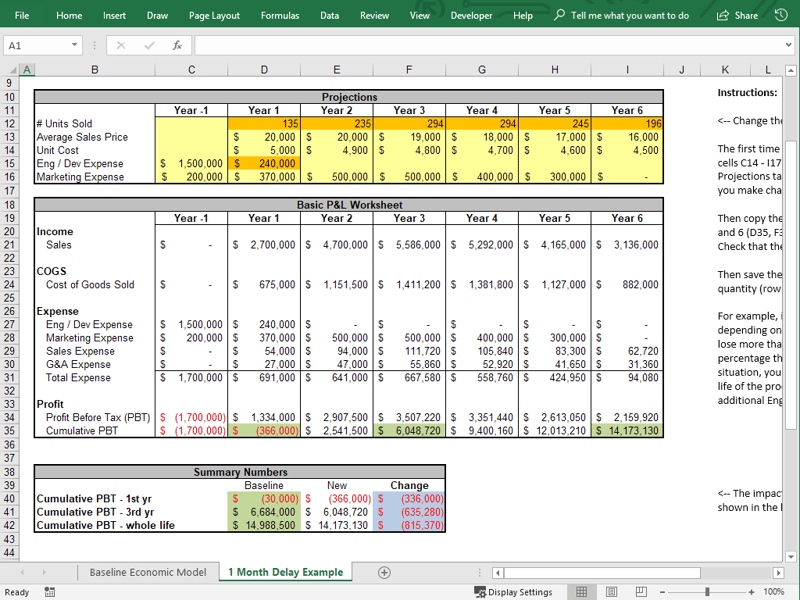
Notice that in just the first year, we’ll lose over $330K dollars of profit, and in the third year over $630K, and the cumulative lifetime COD is over $800K just for being one month late to market!
Would you have guessed $800k before you saw this? That COD is 5 ½ percent of the lifetime profit for just a one-month delay, which happens to be right in line with the study Don Reinertsen did where he said a 6 month delay could cost you 33% of your lifetime profit.
If you’re surprised, don’t worry. Most people are. Don Reinertsen says the average variation between the guesses for COD for people on the same team is 50:1. Think about that. People on the same team have perceptions that vary 50:1 on what it means to be late. This is one of the reasons it’s so important that you get everyone aligned on the value of product development velocity. Otherwise, you can see how there will be disagreement on various decisions. Those disagreements not only cause unnecessary frustration, it's also very likely you’re going to make wrong decisions.
As for this one being $800K, that’s right in the ballpark of a lot of them. We’ve helped a lot of companies develop these and the lowest one I remember was $200,000, and most of them were right around $1M. The largest COD I ever saw was $14M. It was a product for cell phones and they basically lost their whole market for that product version if they were late.
Things to consider when calculating cost of delay
When we were looking at the sales loss in our spreadsheet example, I said there was a decreasing loss the first two years, and a 2% loss each year after that. Those were assumptions based on a typical market scenario, but they can vary a lot depending on what kind of market you’re in. As I mentioned, these are explained in Don’s second book (MDF).
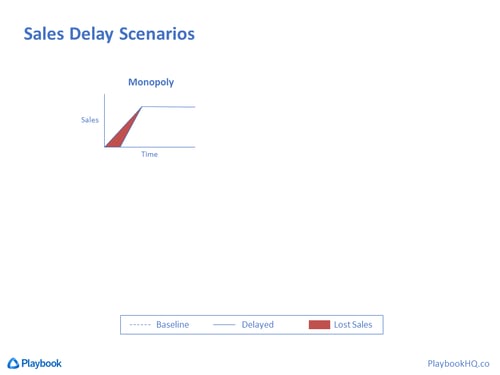
The first example is of a monopoly market. The dashed line is showing your baseline projections. And the solid line shows the sales you’ll get if you’re late. Notice in this scenario you end up with a pent-up demand so that your ramp is actually steeper and you end up with the same level as you would have.
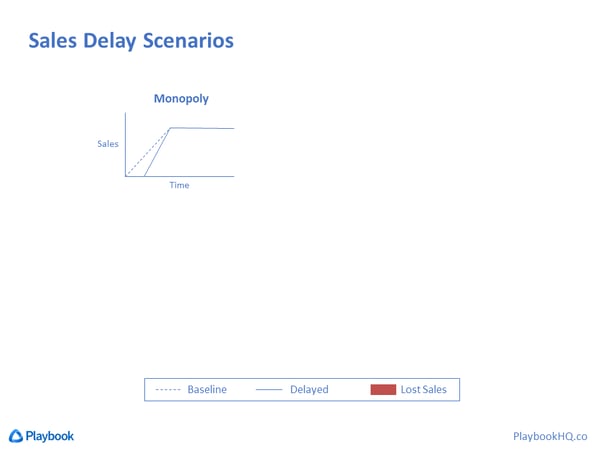
So, your lost sales is represented by the area in red. This scenario has the lowest cost of delay, but it’s also very rare.
In a Market Development scenario, you’ll ramp up at the same rate you would have and still reach your peak, but at a later point. In a Typical Market, some of your customers will go elsewhere so you won’t get the same peak. And for a product with a High Switching Cost, you’ll ramp slower than you would have, as well as get less sales. These can be seen in the image below.
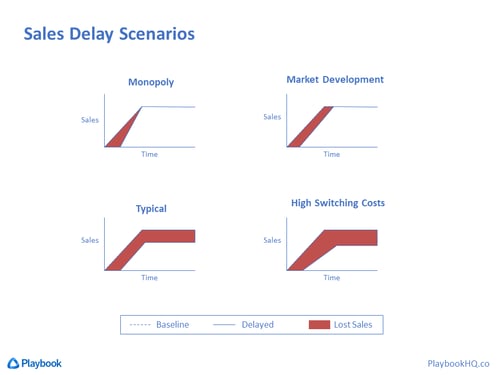
And in all of these scenarios, your sales still end when they would have, so your total market window is shorter. To be clear, these are greatly simplified with straight lines just to make a point. In real life these two lines will be curves of some sort.
So, how do you know which scenario you have? You’ll have to figure it out and I encourage you to not to develop this on your own. Get help from sales, marketing, product or program management, and finance. This will not only make it more accurate, but as I mentioned earlier, it’s critically important that you develop buy-in for this overall concept, as well as the final number you get, so that it’s accepted throughout the company. You will be using Cost of Delay to make decisions that affect all departments so it’s important they know where it came from, and everyone agrees with it.
Another thing to consider is that this was a simple spreadsheet model. Once you start using it, it will probably be easier to create a “Sales Delay Scenarios” page where you can enter the lost sales by percentages for various amounts of delay, and then show these on a graph. It’s not only easier to estimate percentages rather than units, but the graph helps you visualize the impact and get consensus on whether the numbers are correct.
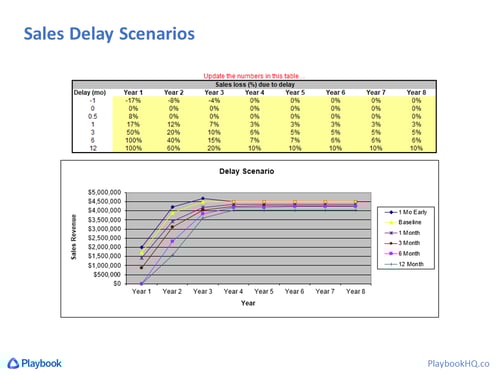
By the way, it’s not always true that a 6-month delay has the same impact as one month multiplied by six. So if the lateness of your products varies by very much it’s probably worth it to estimate multiple delay amounts separately, and this makes that easy to do as well.
Also, notice in this example that the yellow line is the baseline and we also modeled being one month early, so it actually shows the net gain. After all, if you’re implementing the right lean/agile tools, you should expect to get done early(!!!)
Another thing to point out is that we used relative years starting with product launch, but you can also use calendar years instead. You might have to do this if your finance group wants it to match your company’s fiscal year, or if you want it to be clear where the seasonal sales bumps are. It’s a bit more tricky to do it that way because if your target launch date is on Oct 1 there will only be three months left in that year, so a one month delay will be one-third of the remaining year. So you have to be more careful when you enter the numbers but it will work out.
Whichever method you use, remember there might be non-linear impacts from delay for things like trade shows. Missing that by a month could lose almost a year of sales if that’s your primary marketing event. In fact, one of our case studies is from a medical device company that thought they needed fourteen months to finish their product, but they literally got done seven months early and made it to the trade show a year before they expected to. This resulted in a $15M increase in profit(!!!)
Benefits to knowing the cost of delay
Let’s review the benefits…
- Quantify the value of Time to Market
- Prioritize projects so resource conflicts can be resolved
- Know when to expedite activities
- Use it to focus the team on the value of speed* (*"Speed" does not mean cutting corners, working more hours or more chaos...!)
- Allows you to put a dollar value on the cost of your queues so you know which ones to improve
You most likely hear Senior Management talk about the value of speed, but I rarely hear a number applied to it. If you do this, you’ll finally be able to attach a number to that general directive.
Once you know your COD for each project, you can use it to prioritize projects and therefore have an easy way to resolve conflicts.
The team members can know when it makes sense to expedite things, and they will be much more sensitive to the importance of the schedule.
(*I want to include an important footnote here. I’ve heard engineers say that they’re already going too fast and they need more time. The proper Lean and Agile methods do not require cutting corners or sacrificing quality, or working harder. In fact it’s the opposite. If you have implemented the right set of lean and agile methods, Team Members will have clear priorities for all of their projects, they won’t have to multitask, they’ll know when their tasks are urgent or not, and everyone can see when someone is overloaded. So it really feels like there’s less work and it’s all getting done faster.)
The final benefit is that it allows you to put a dollar value on the cost of your queues. If you want to improve cycle time or project throughput, you have to start seeing and fixing your queues.
Summary
First of all, do this. I promise you it will change everyone’s perspective, and it’s not that hard to do.
If you’re on the fence, do the survey first where you ask them to guess what they think the Cost of Delay is. If you see a lot of variation, then you’ll know this is important. You can also share these 7 benefits of calculating cost of delay.
It doesn’t have to be perfect. Any number you come up with is going to be better than guessing.
The goal is to get everyone more closely aligned and have buy-in to the relative size of the number, not to have a perfect number.
You get the buy-in by having everyone participate and provide feedback on the model. And it’s better to have a simple model that everyone understands than it is to have a complex model that’s only slightly more accurate but people don’t understand it.
Closing
If you have any questions send me an email and I’ll be happy to answer them. Or, if you want the template, click the link below.
If you like this video, subscribe to our channel so you’ll be notified when we release more lean-agile training videos.
You can also download our Guide to Cost of Delay.

Finally, since this topic focused on the importance of development speed, we have a video on our home page that has two paradigm shifting ideas around the biggest cause of late projects, and what to do about them.
Good luck, and here’s to faster projects!
Other resource that may be of interest:
7 Benefits of Calculating Cost of Delay
Don Reinertsen's Book List
Free Template For Calculating Cost of Delay
Cost of Delay and How to Calculate It
Guide to Cost of Delay
WSJF and Architectural Runway
Don Reinertsen on cost of delay
Wikipedia on cost of delay
